new
improved
Reporting & Broadcasts Analytics Revamped
We’ve updated the Reports Module with new and important metrics and features to help you gain deeper insights into your Workspace. Let’s dive in.
More Detailed Insights at Glance
Every company has its own way of calculating performance. To reflect this, the Reports Module has been upgraded to offer more comprehensive details and a customizable approach to measuring performance.
To provide companies with more insightful and tailored metrics, we have enhanced data precision with additional tabs and filters, and our improved charts and tables effectively convey complex data. You can now perform in-depth analyses of the following:
- Conversation volume and traffic
- Response and resolution times
- Messages sent and received
- Contact assignment
- Contact addition, connection, deletion and merge
- Broadcast performance
We are confident that these will empower you to make more informed decisions and optimize your Workspace for better results.
Measure Performance Based On Assignment Time
Previously, the Reports Module measured response and resolution time according to how long agents took to respond to customer messages. However, for businesses that don’t operate 24/7, messages received outside business hours skewed these metrics. We're excited to introduce new metrics that allow you to measure performance based on first or last assignment time.
Look out for the following graphs in the Responses and Resolutions Module:
Average First Assignment to First Response Time
This metric excludes the time the Contact assignment took, counting only the average time agents take to send the first response once they’ve been assigned.
Average First Assignment to Close Time
This metric excludes the time the Contact assignment took, counting only the average time agents take to resolve a conversation once they’ve been assigned.
Average Last Assignment to Response Time
This metric is useful to measure how long the last agent took to send a first response to the conversation that had been escalated or rerouted.
Average Last Assignment to Close Time
This metric is useful to measure how long the last agent took to resolve a conversation that had been escalated or rerouted.
The Breakdown tables on the right can be used to identify trends in assignment, response and resolution times to fulfill Service Level Agreements and spot areas for improvement.
Improved User Performance Reports
While it was previously possible to gauge user performance by metrics such as closed conversations and average resolution time, we wanted to provide businesses with more tools to better track and optimize efficiency.
Loaded with multiple intuitive graphs, the Leaderboard tab and Users tab offers a more detailed view into individual and team performance. What’s better, you can now compare performance among team members or teams to identify top or weak performers.
Advanced Filtering Options
Notice the new and improved filtering options in the Reports Module? Now you'll find a wide range of filters added to each tab, which will allow you to perform more in-depth analyses of your Workspace. These filters will help you segment data based on specific criteria such as channels, teams, conversation categories, assignments, and more. Spotting trends and issues in your operations has never been this easy with respond.io!
New Broadcast Analytics Tab
Our old Reports Module did not include broadcast analytics. By popular demand, here’s the new Broadcast tab! Now, you can measure the performance and impact of your campaigns more effectively.
Here you can find out the total number of broadcast recipients as well as the read rates. You can also view the number of and failed broadcasts, total messages sent and the delivery status of your broadcast messages: Sent, delivered, read and failed.
Breaking down broadcast analytics to a message level is possible too. In the Messages tab, click on
Add Filter
and search for Broadcast Name
. This filter lets you identify specific Contacts who have received or failed to receive your message in the selected broacast, as well as the delivery status of your message for each Contact.Note: Certain new graphs and tables presented are only applicable to new data collected from the launch date onwards.
Does the new Module spark your enthusiasm? To find out more about the new Reports Module, visit our Help Center. This feature is only available for Business plan users and above. Upgrade now to start using the new Reports Module!
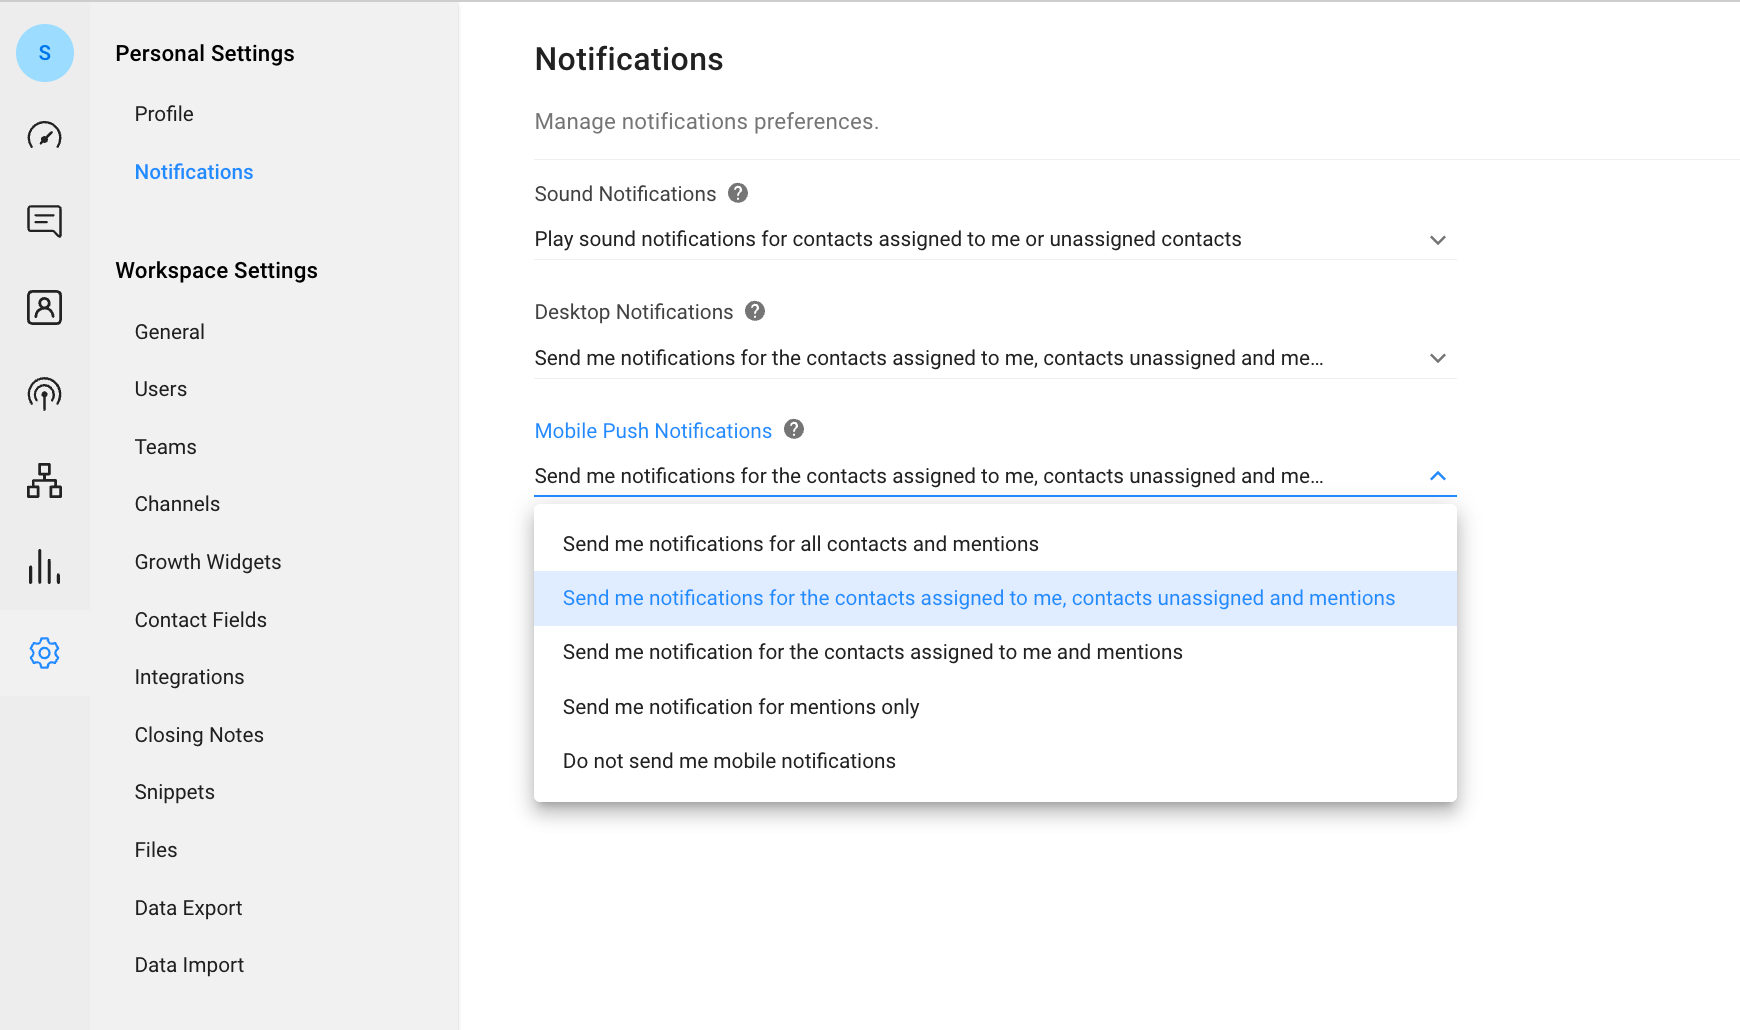
Last but not least, as part of this release, we have made enhancements to the notification preference feature. You can access it by going to Settings > Notification Preference. Explore the newest functionality now available in both Desktop and Mobile Push Notifications, allowing you to receive notifications for assigned contacts, unassigned contacts, and mentions!